Reports
The Reports section provides ten read-only views of your data, each with an optional CSV export. Navigate to Reports from the sidebar and use the tab bar to switch between report types.
Every report that accepts filters reloads its data automatically when a filter value changes. All CSV exports are generated in the browser from the currently-loaded data.
Stock Levels
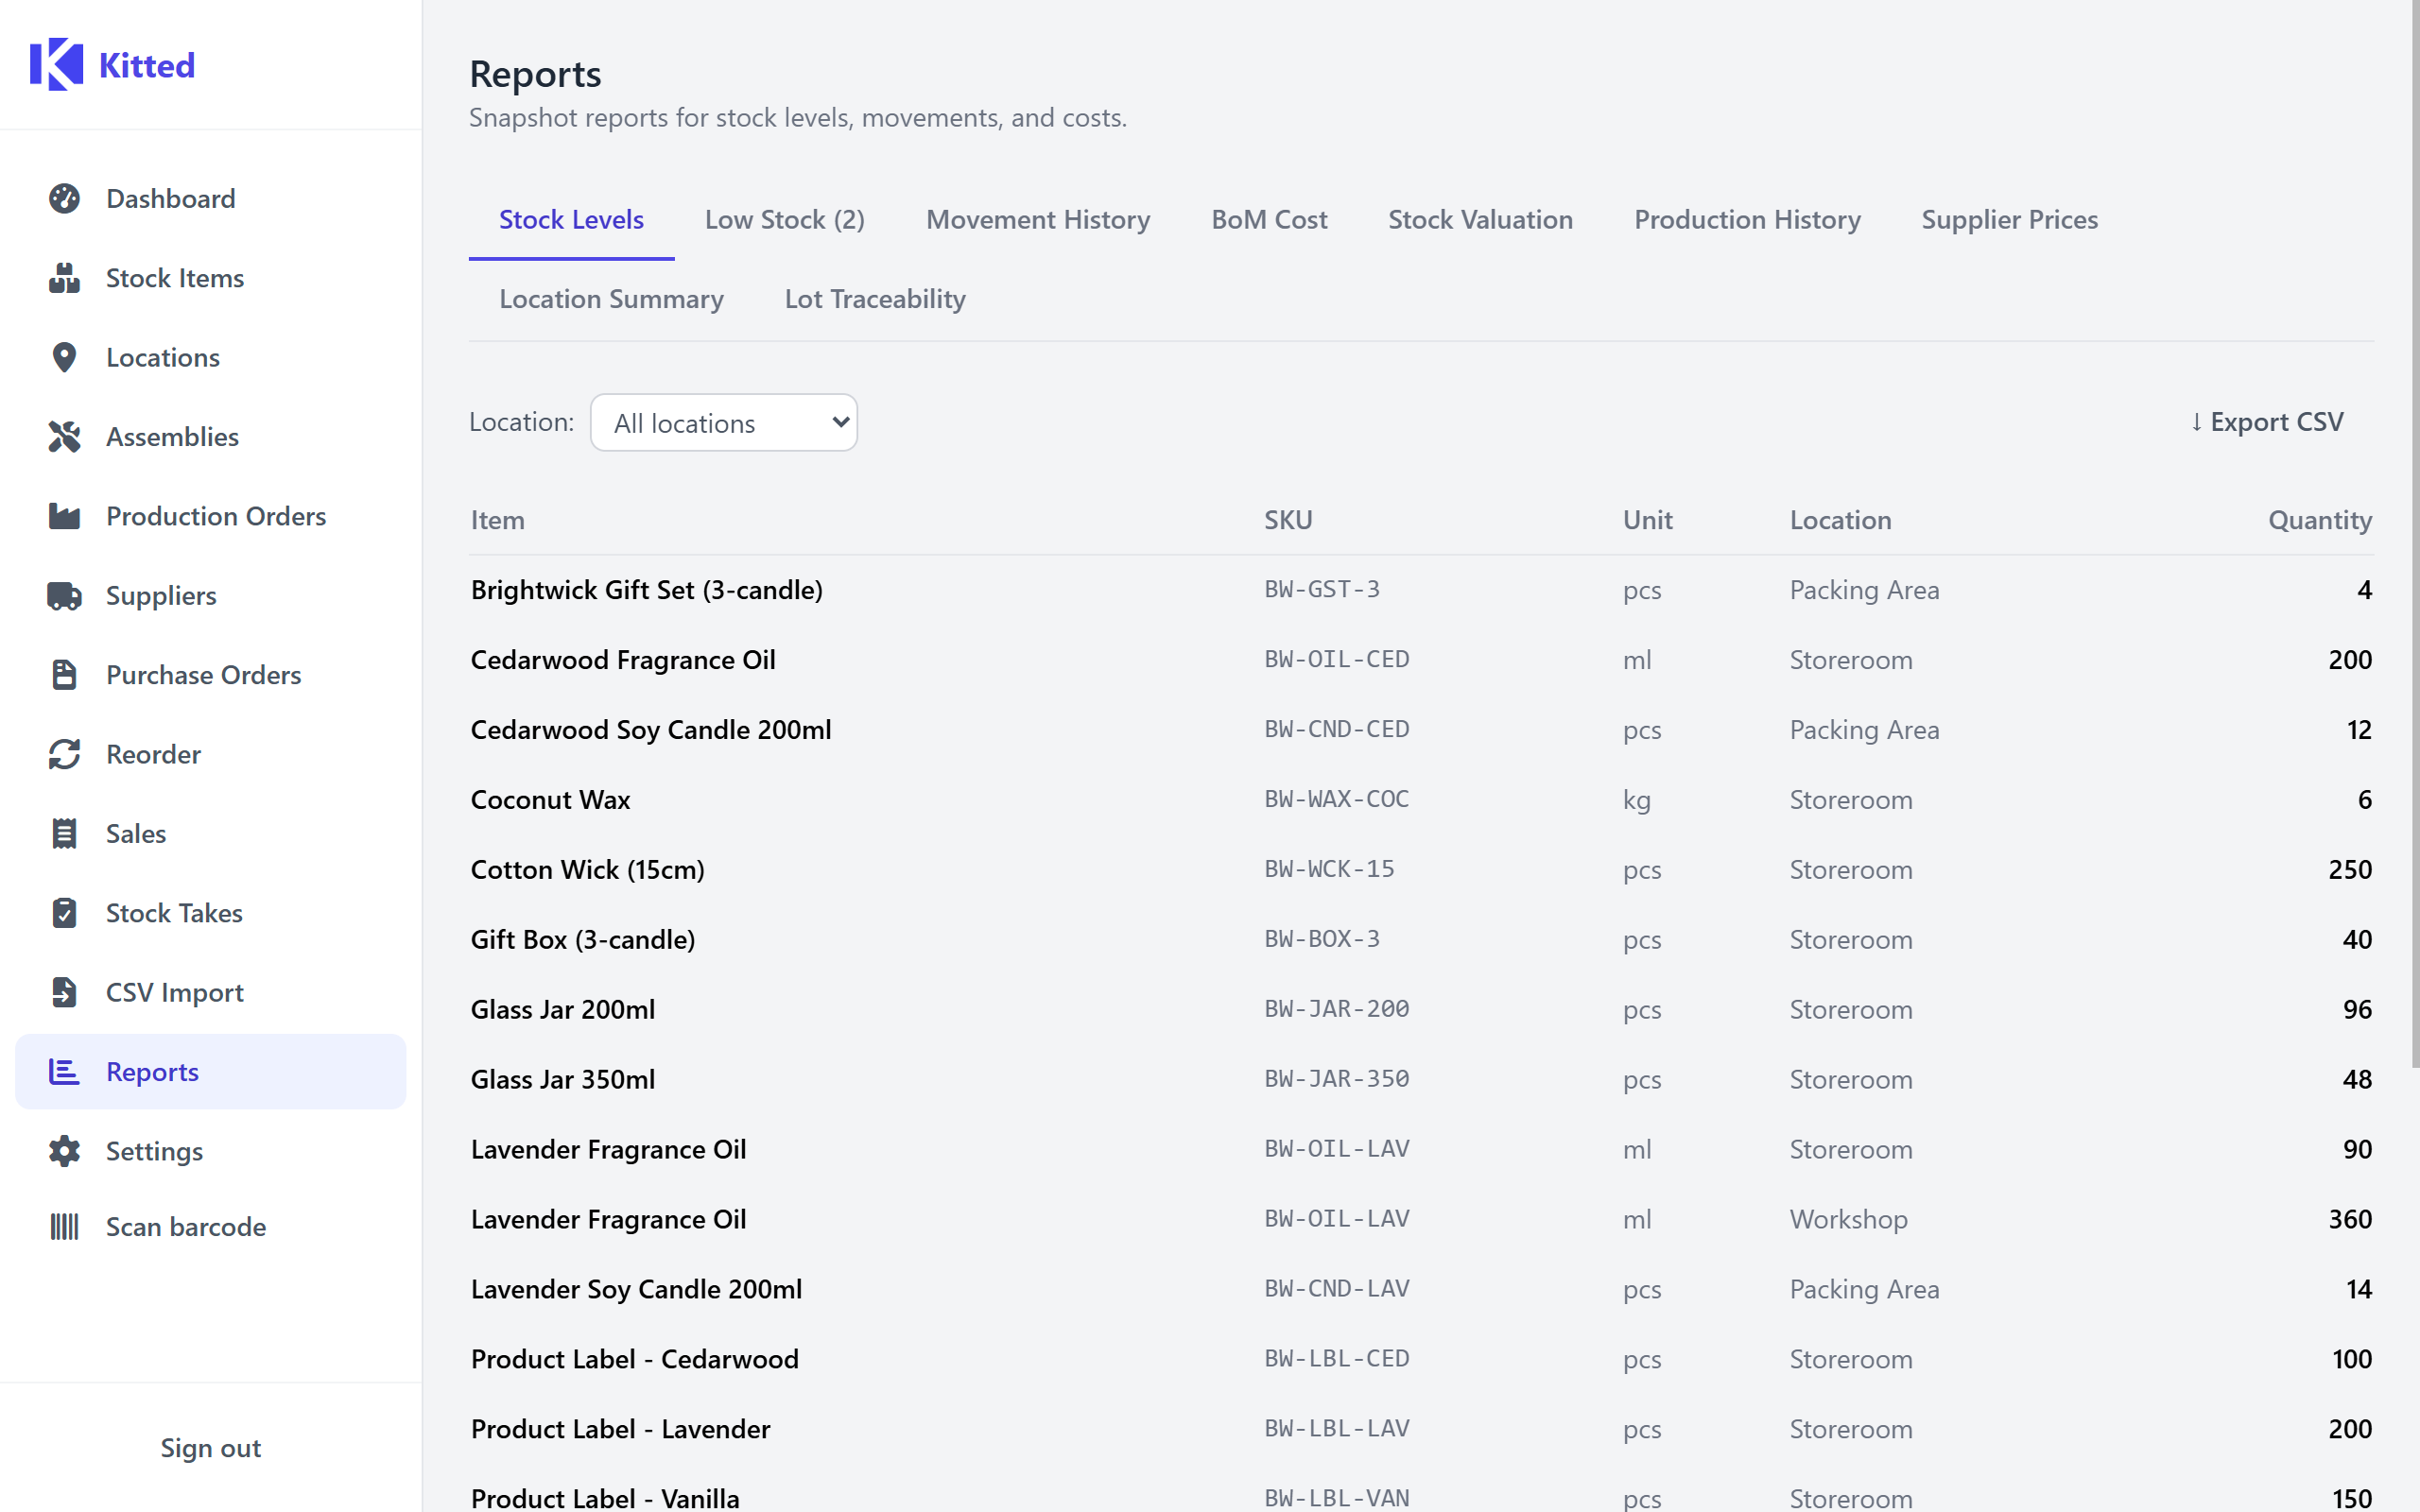
A flat list of every non-archived stock item and the quantity held at each location (left-joined, so items with no stock records still appear with a zero quantity).
Filters: Location dropdown - choose a specific location or leave blank for all locations.
Columns: Item name, SKU, Unit, Location, Quantity, Min stock level.
Export: stock-levels.csv
Low Stock
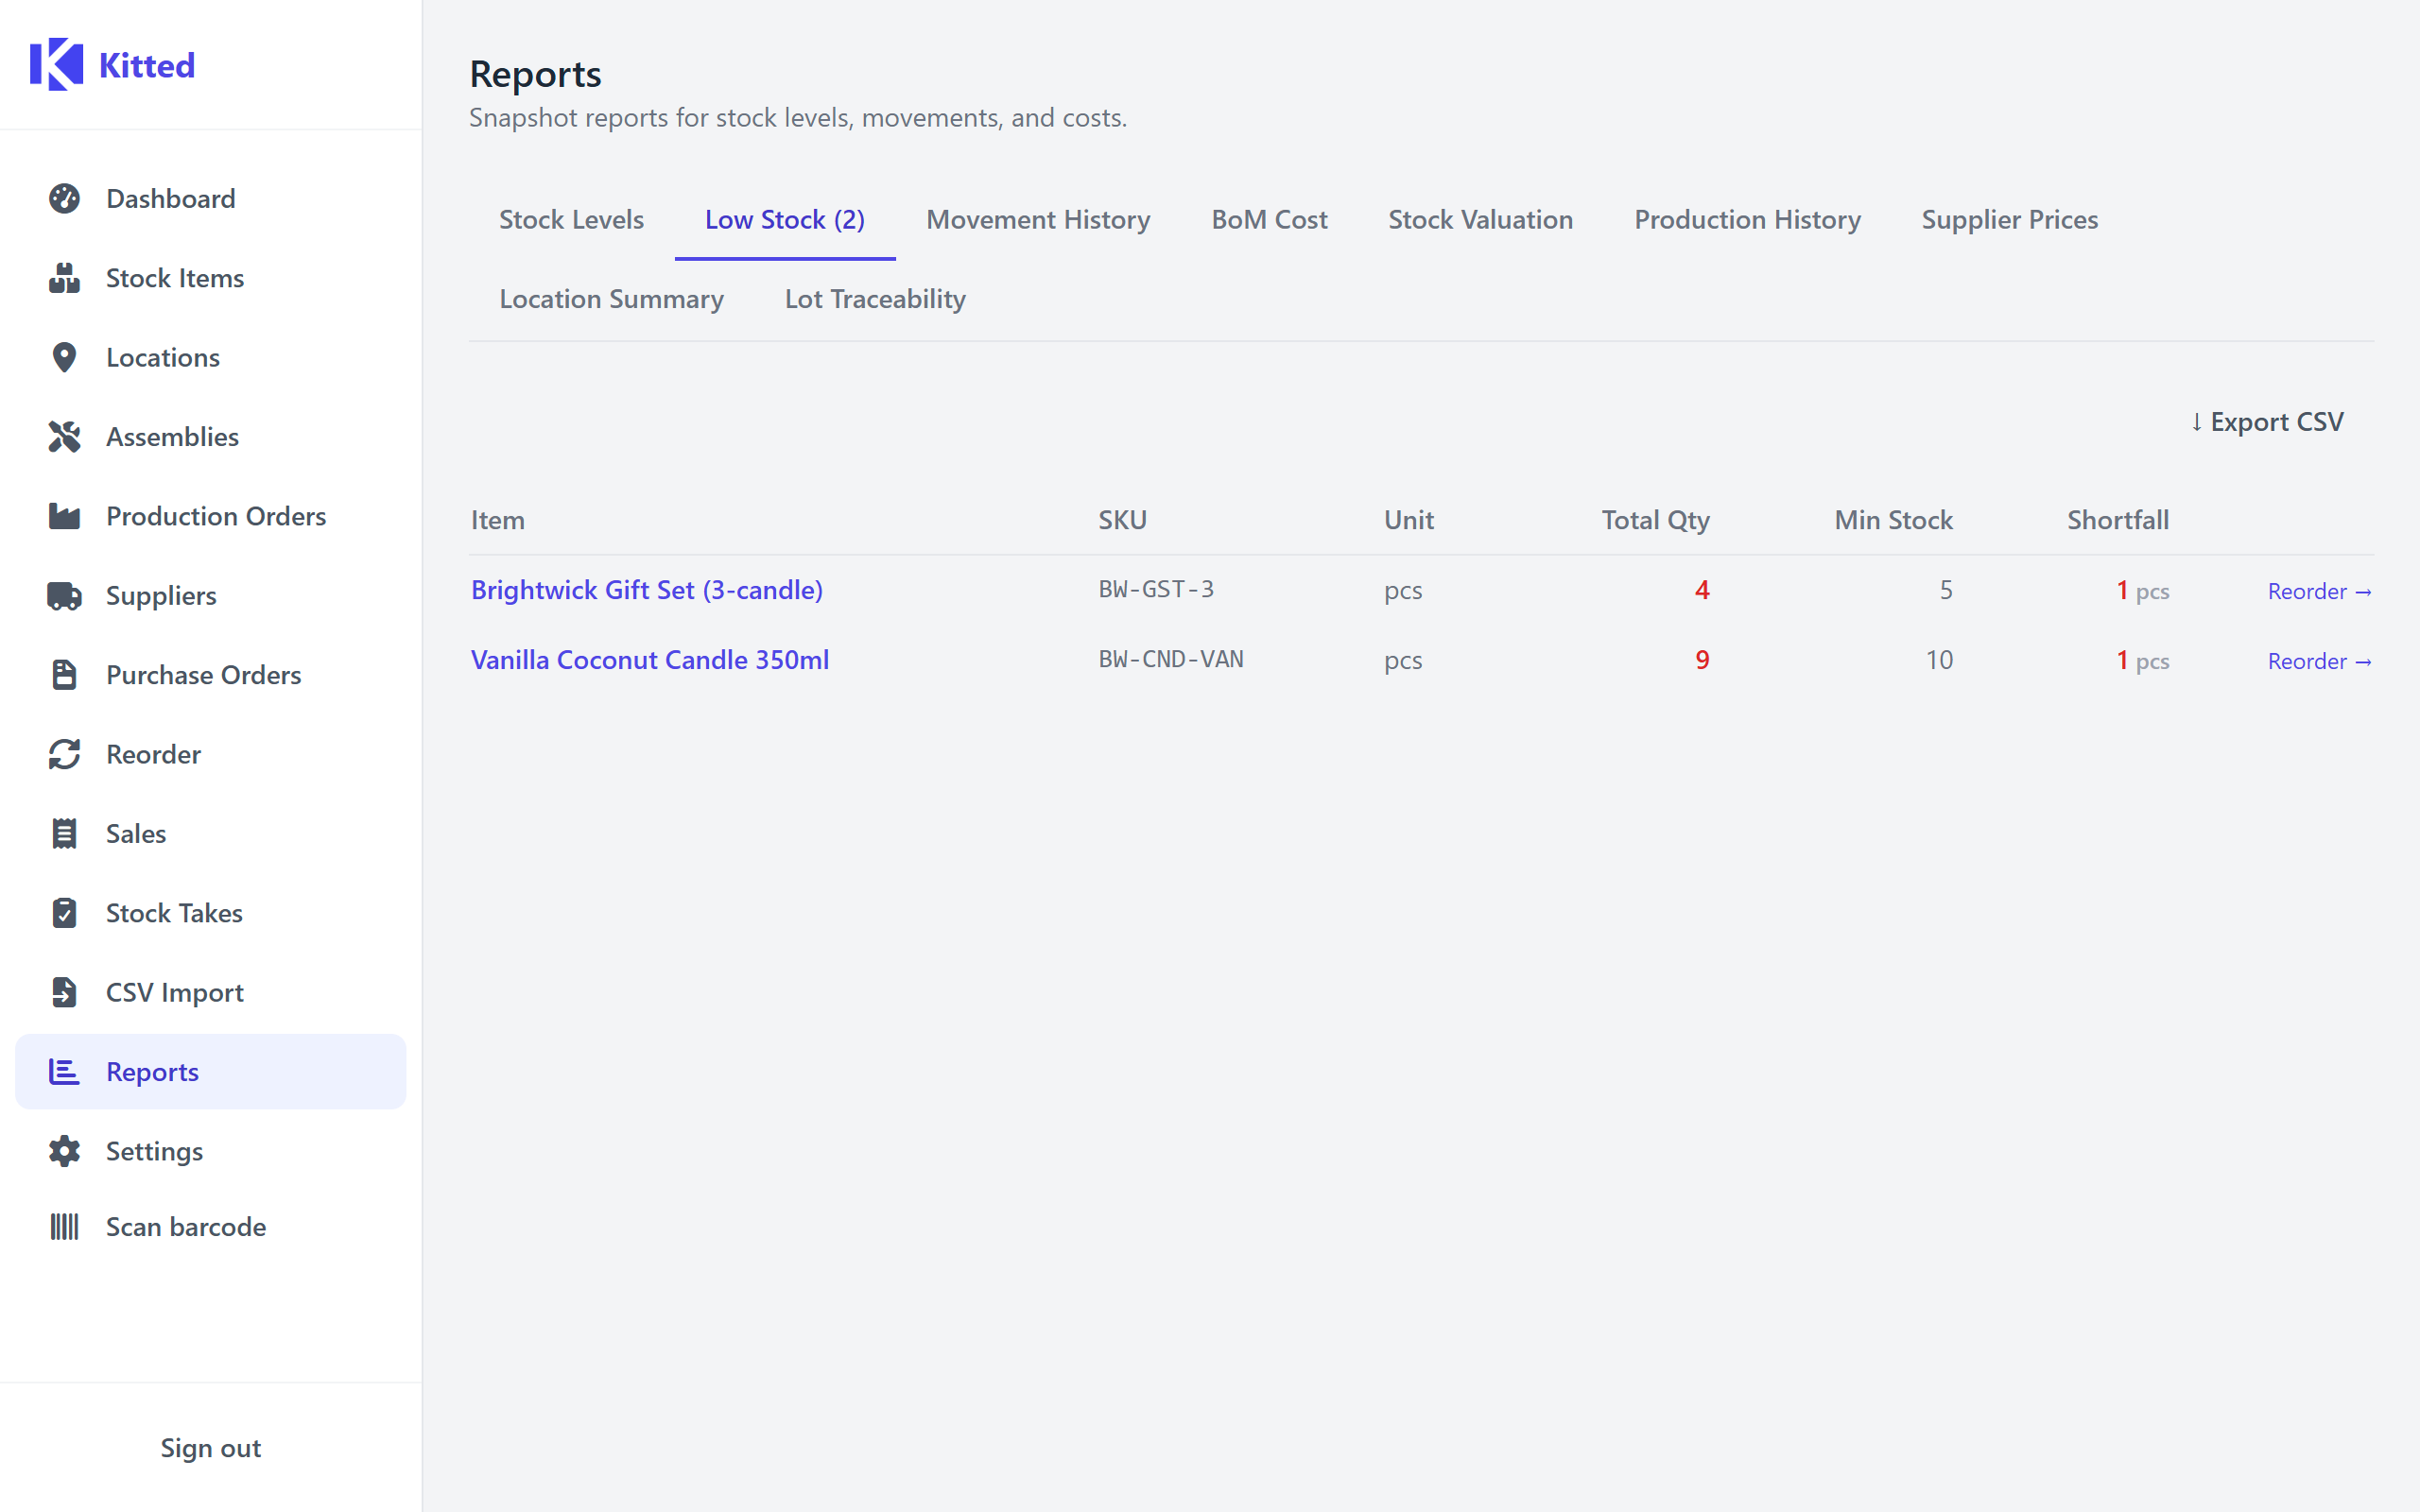
Shows only items whose total quantity across all locations is below their minimum stock level. Identical source data to the Reorder Workbench but presented as a simple read-only list.
Columns: Item name, SKU, Unit, Total quantity, Min stock level, Shortfall (min − total).
Export: low-stock.csv
Movement History
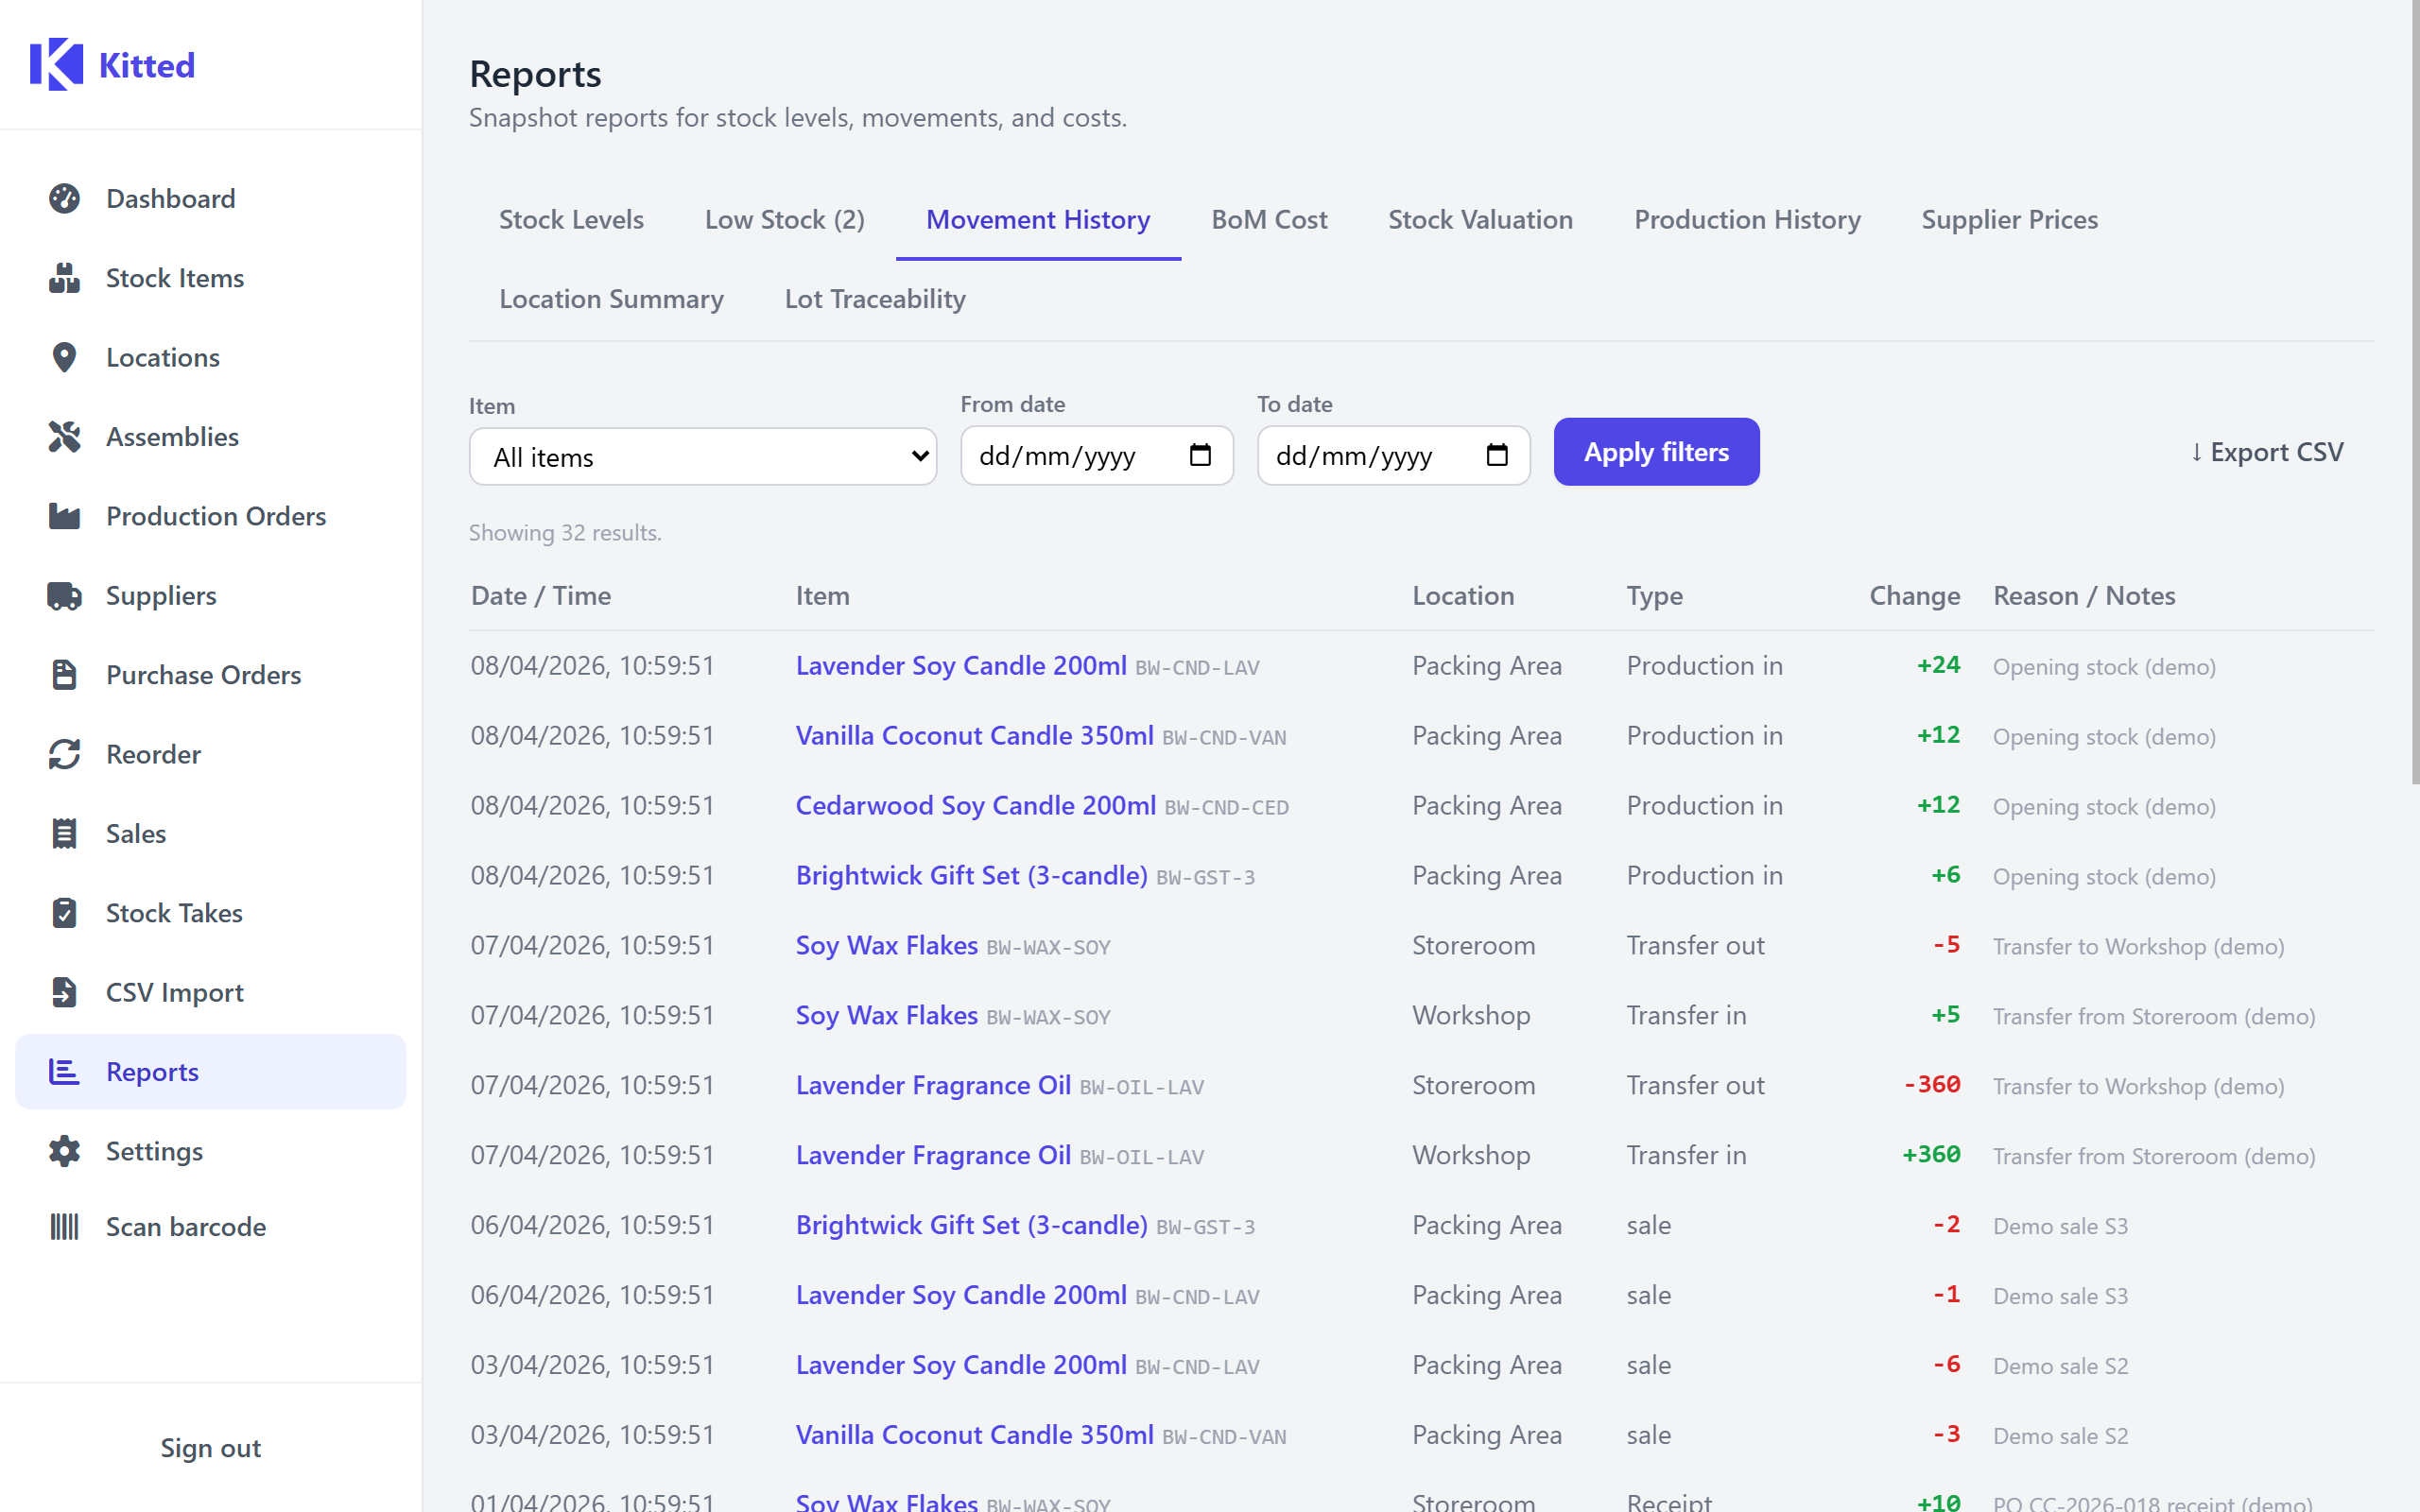
A reverse-chronological log of every stock movement in the system.
Filters:
- Item - filter to a single stock item.
- From / To - date range filter (inclusive, applied to the movement’s recorded timestamp).
Up to 200 movements are returned per query (most recent first).
Columns: Date/time, Item name, SKU, Location, Type, Quantity change, Reason.
Movement types shown: Adjustment, Transfer in, Transfer out, Production in, Production out, Receipt.
Export: movements.csv (Date/time in ISO 8601 format)
BoM Cost
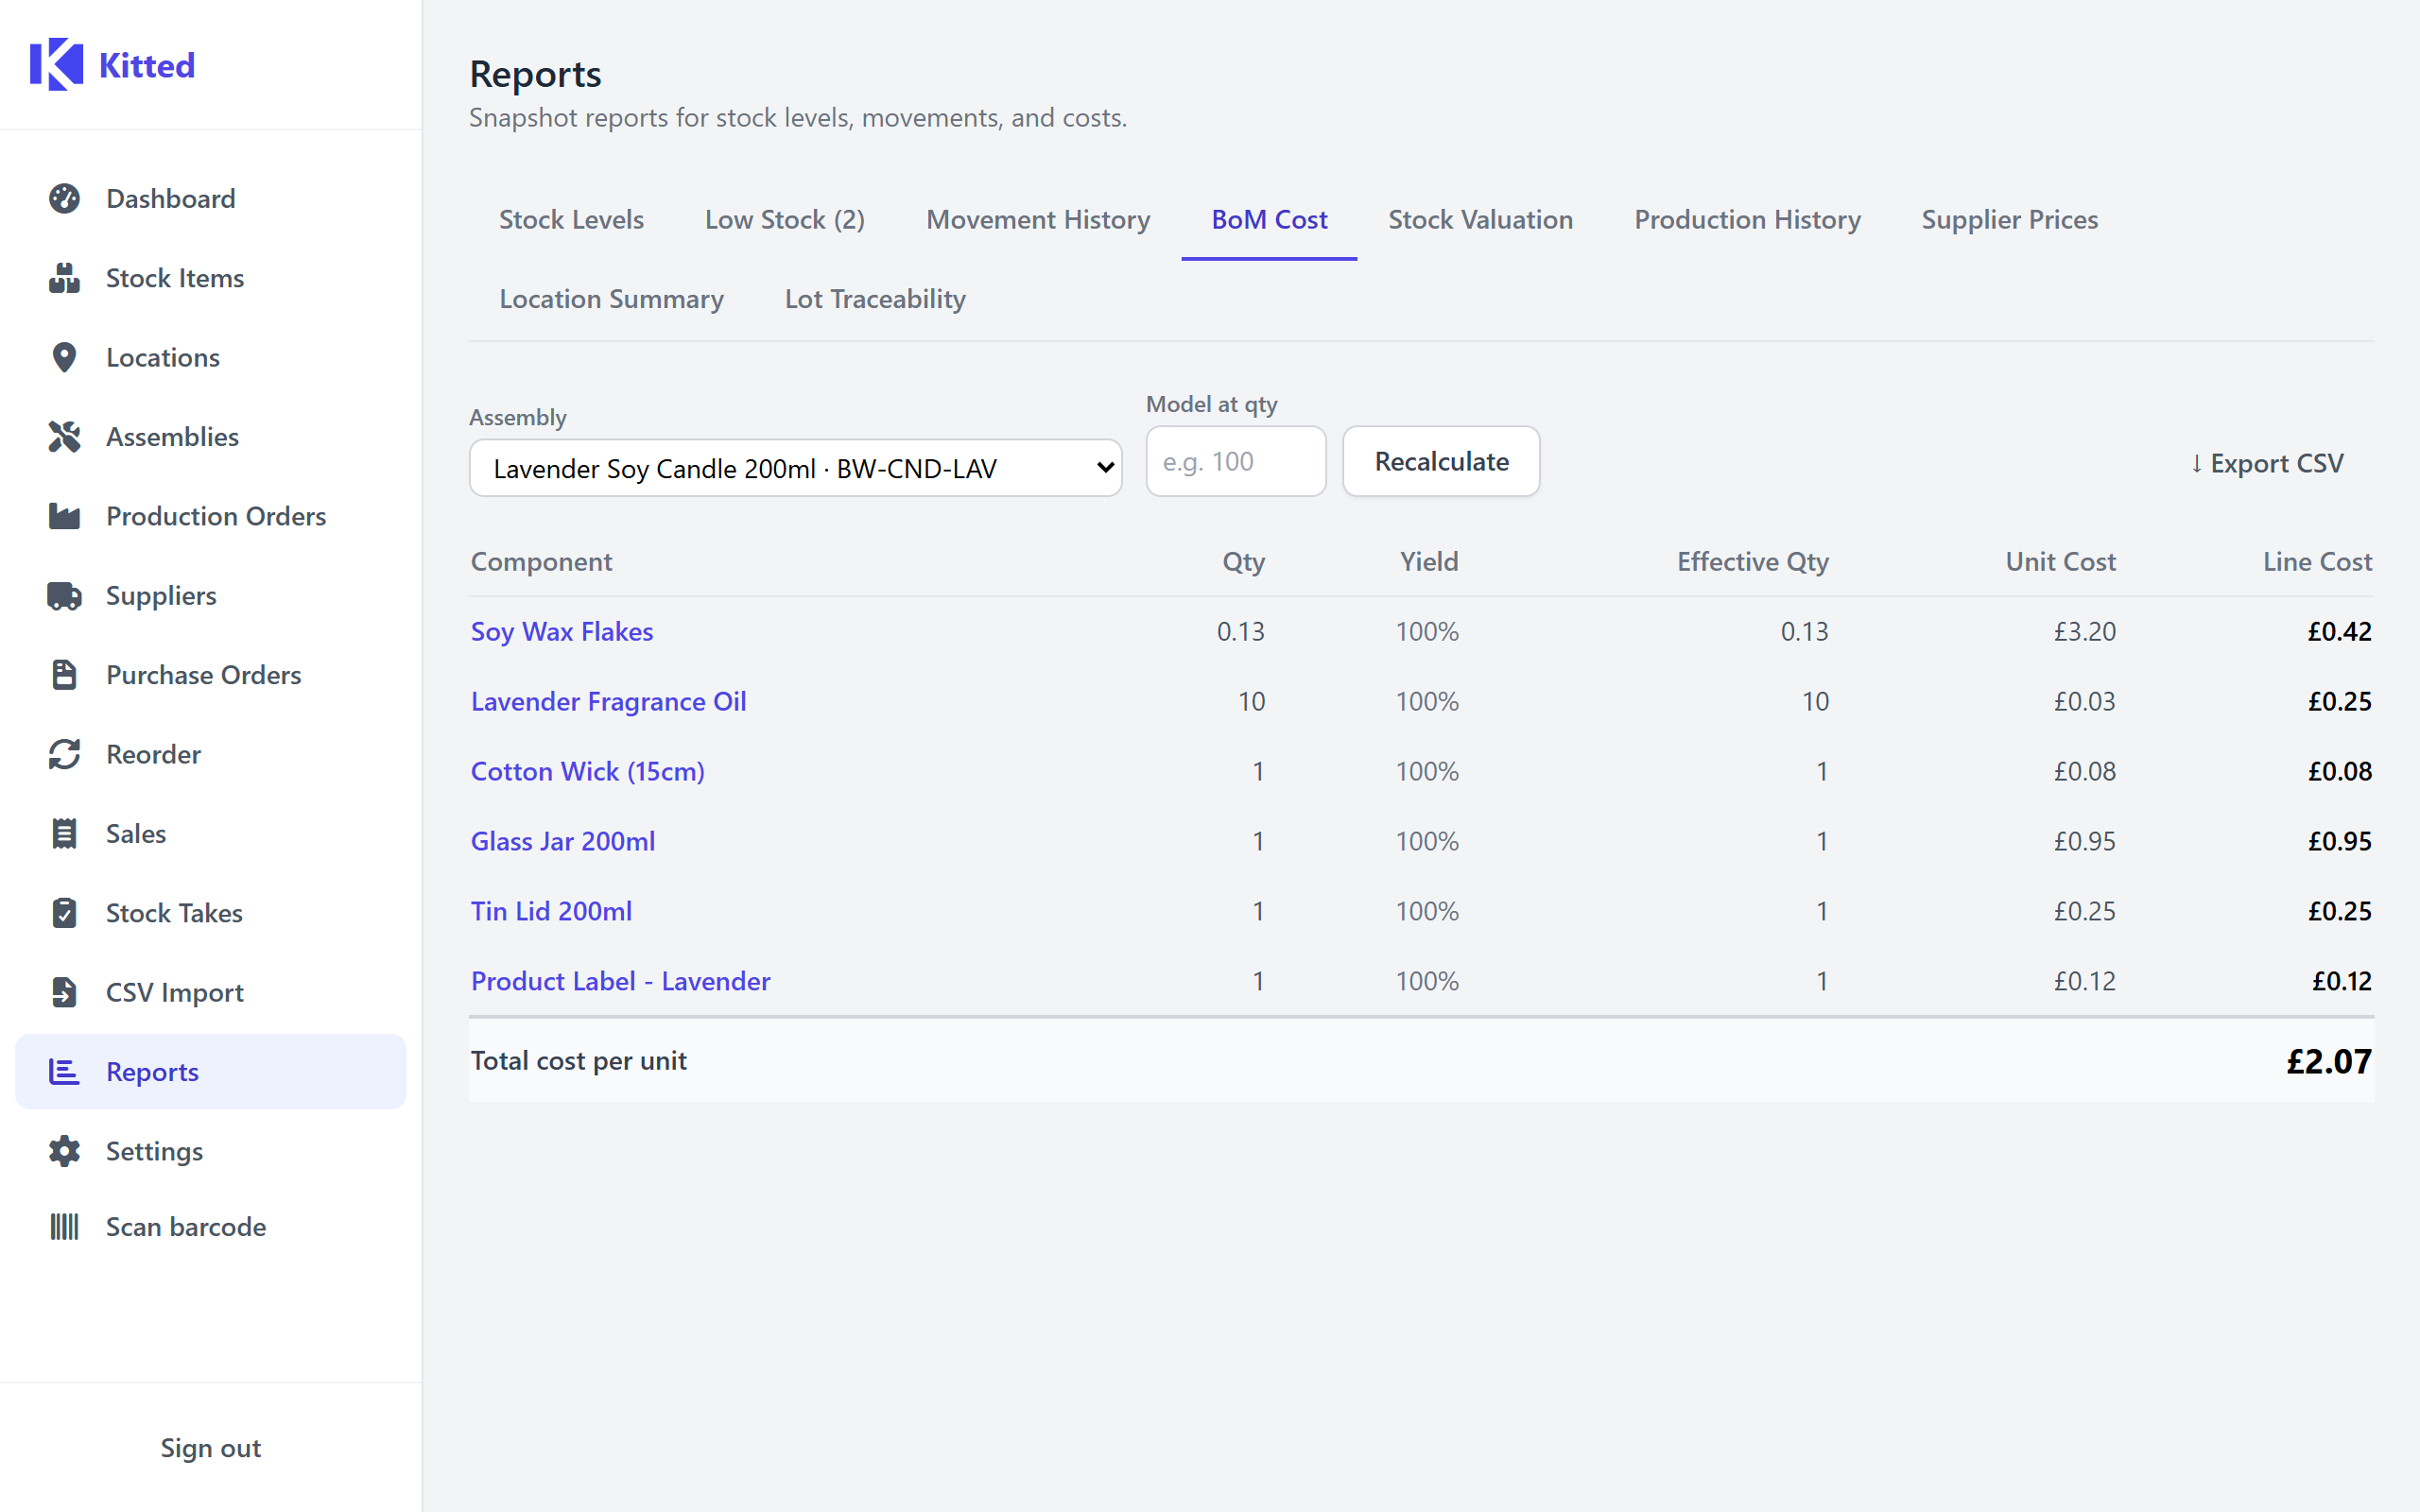
Calculates the rolled-up component cost for a single assembly.
Inputs:
- Assembly - which assembly to cost up.
- Model quantity - optional. Enter a quantity to calculate the total cost for that batch. Leave blank for a per-unit cost breakdown.
The result shows a breakdown table with one row per component in the fully-expanded BoM (including sub-assemblies):
| Column | Description |
|---|---|
| Component | Component name. |
| Qty required | Raw quantity per unit from the BoM. |
| Yield factor | The yield factor applied to this line. |
| Effective qty | qty ÷ yield factor - actual consumption per unit. |
| Unit cost | Cost price of the component. |
| Line cost | effective qty × unit cost. |
| Price source | Shown only when a model quantity is set: cost_price (item’s stored cost price) or price_break (a supplier price break triggered at that quantity). |
The Total cost is the sum of all line costs. Items with no cost price are included in the breakdown but do not contribute to the total (shown as -).
Export: bom-cost.csv
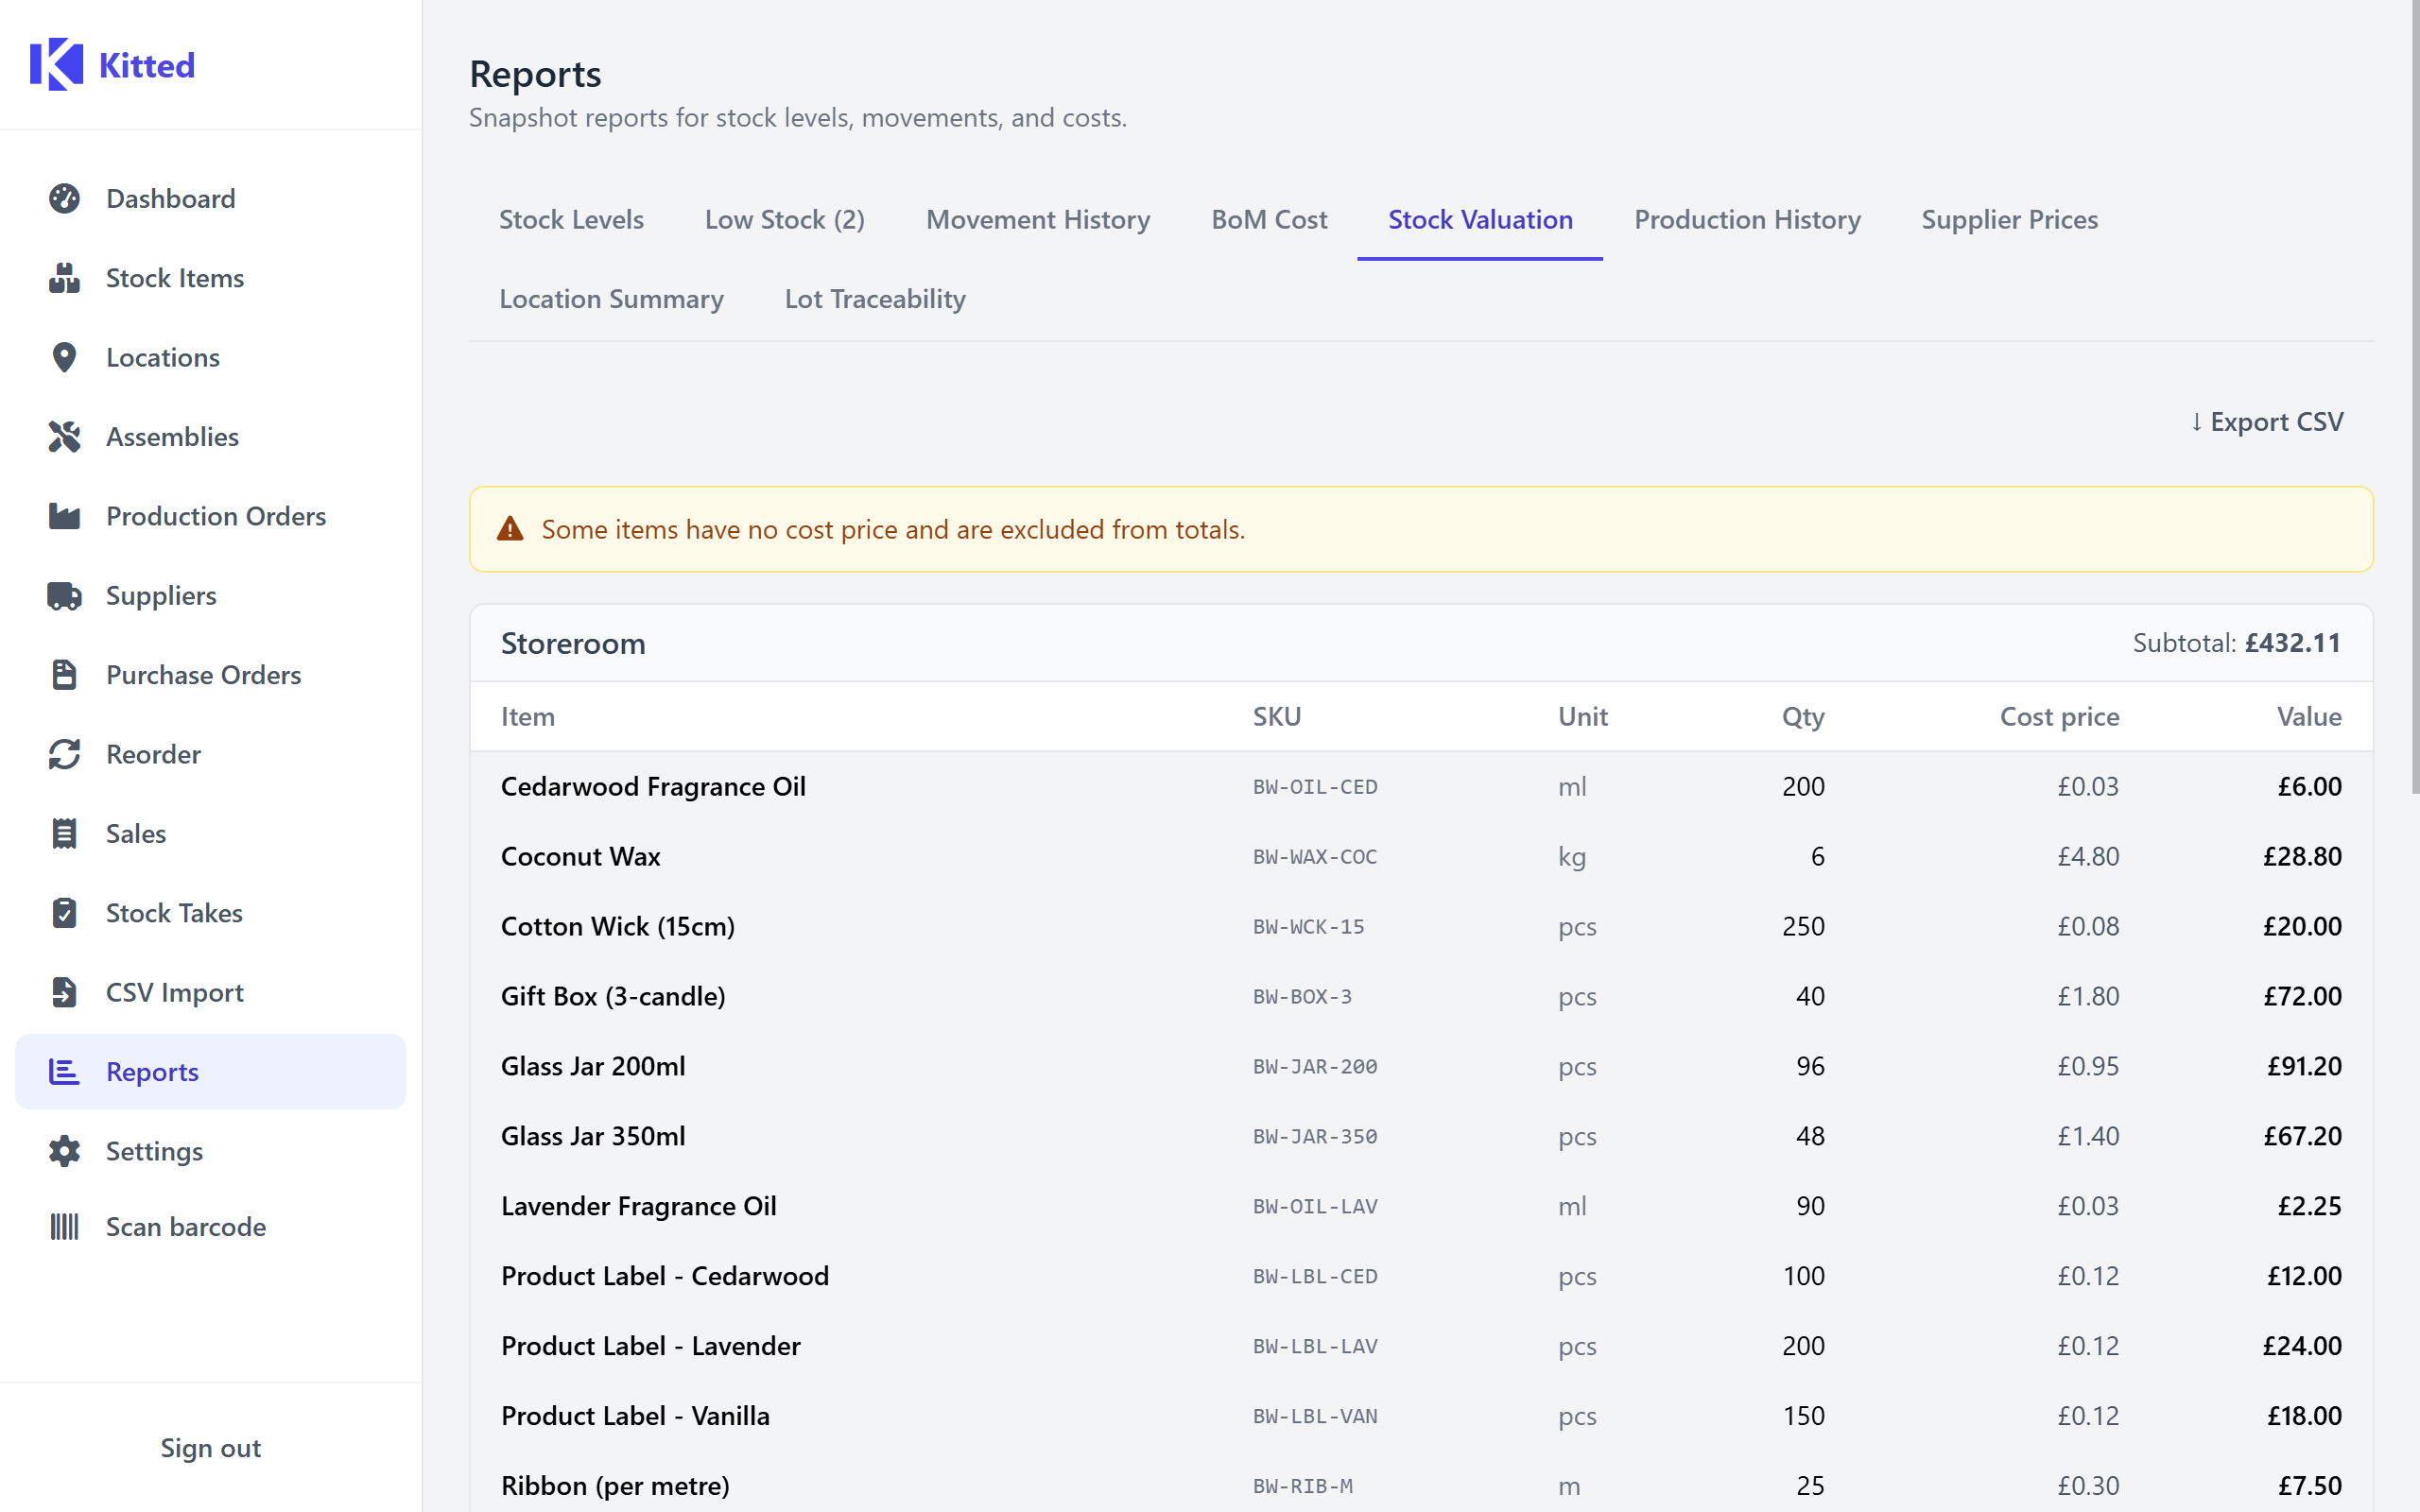
Stock Valuation
The total stock value of your entire inventory, broken down by location and item.
Columns: Location, Item name, SKU, Unit, Quantity, Cost price, Line value (quantity × cost price).
Items without a cost price are included but have a blank Line value and do not contribute to the grand total. The grand total of all valued lines is shown at the bottom of the report.
Export: stock-valuation.csv
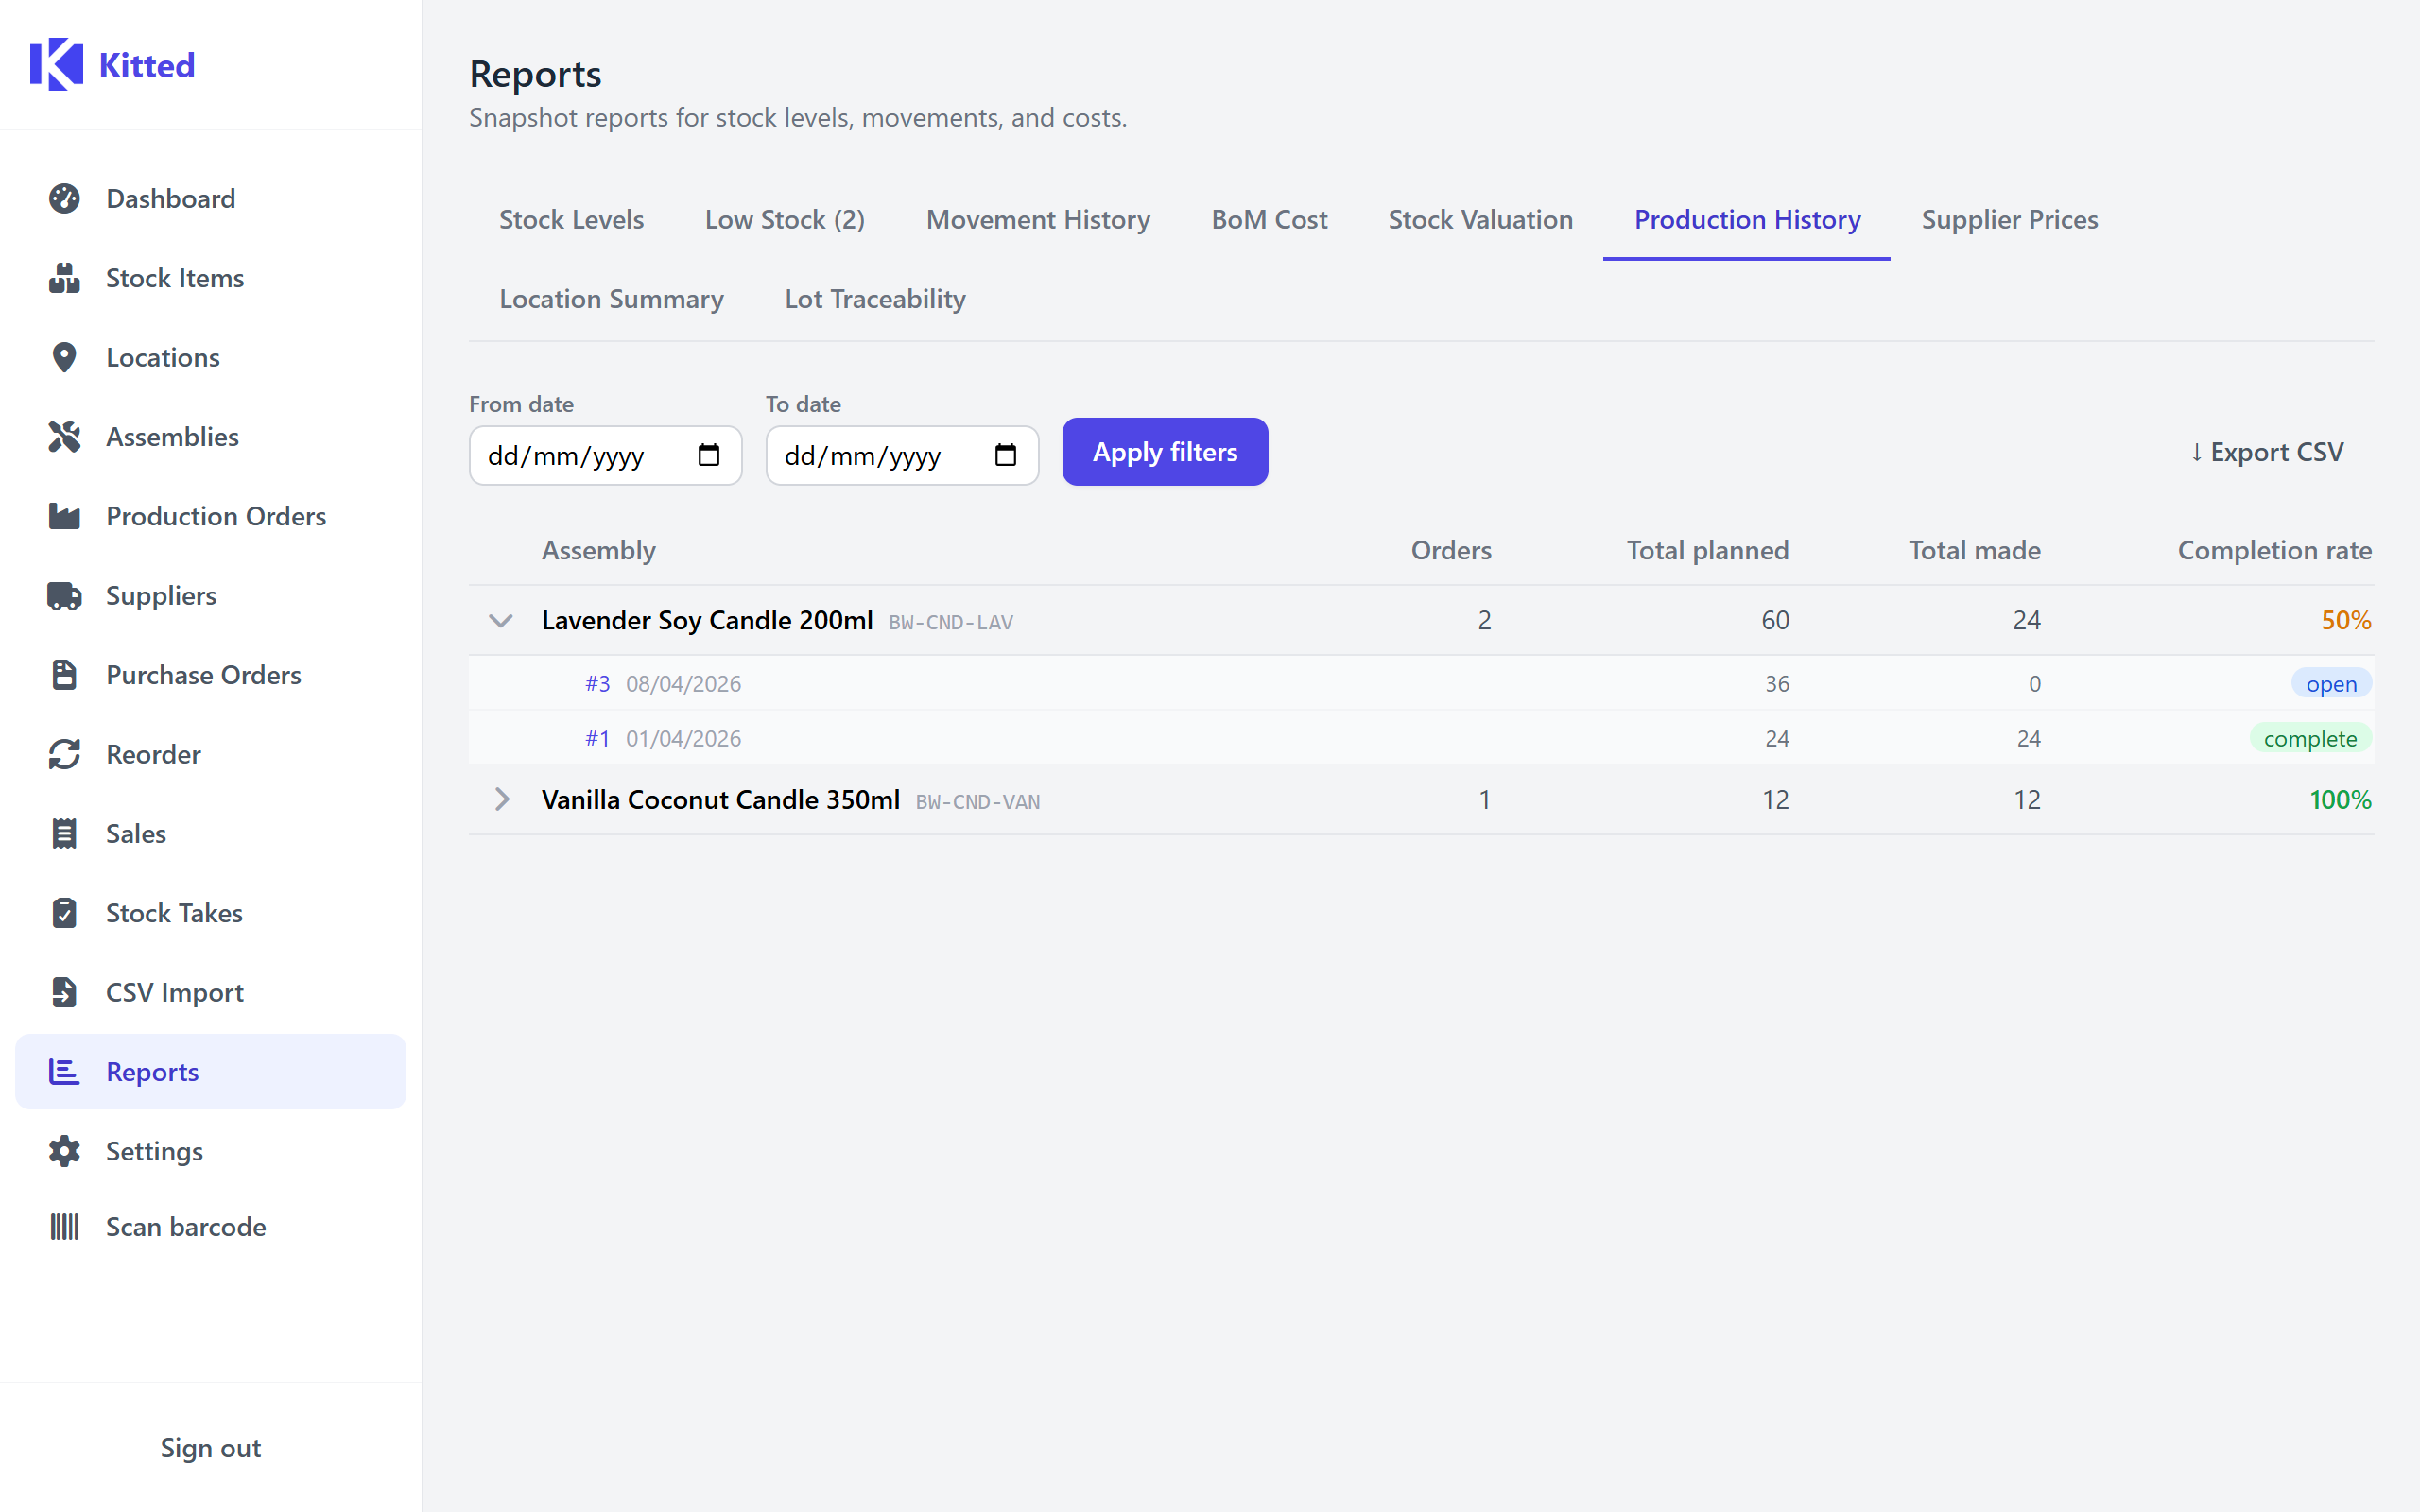
Production History
A summary of all production orders, grouped by assembly, with optional date range filtering.
Filters: From / To date range (applied to the order’s creation date).
Each assembly row shows:
| Column | Description |
|---|---|
| Assembly | Name and SKU. |
| Orders | Total number of production orders raised. |
| Qty planned | Cumulative planned quantity across all orders. |
| Qty made | Cumulative quantity actually produced. |
| Completed | Number of orders with status Complete. |
| Completion rate | completed ÷ orders as a percentage. |
Expand an assembly row to see the individual orders under it, including each order’s ID, planned vs. made quantities, status, and the BoM snapshot that was in effect when the order was raised.
Export: production-history.csv (one row per order, not grouped)
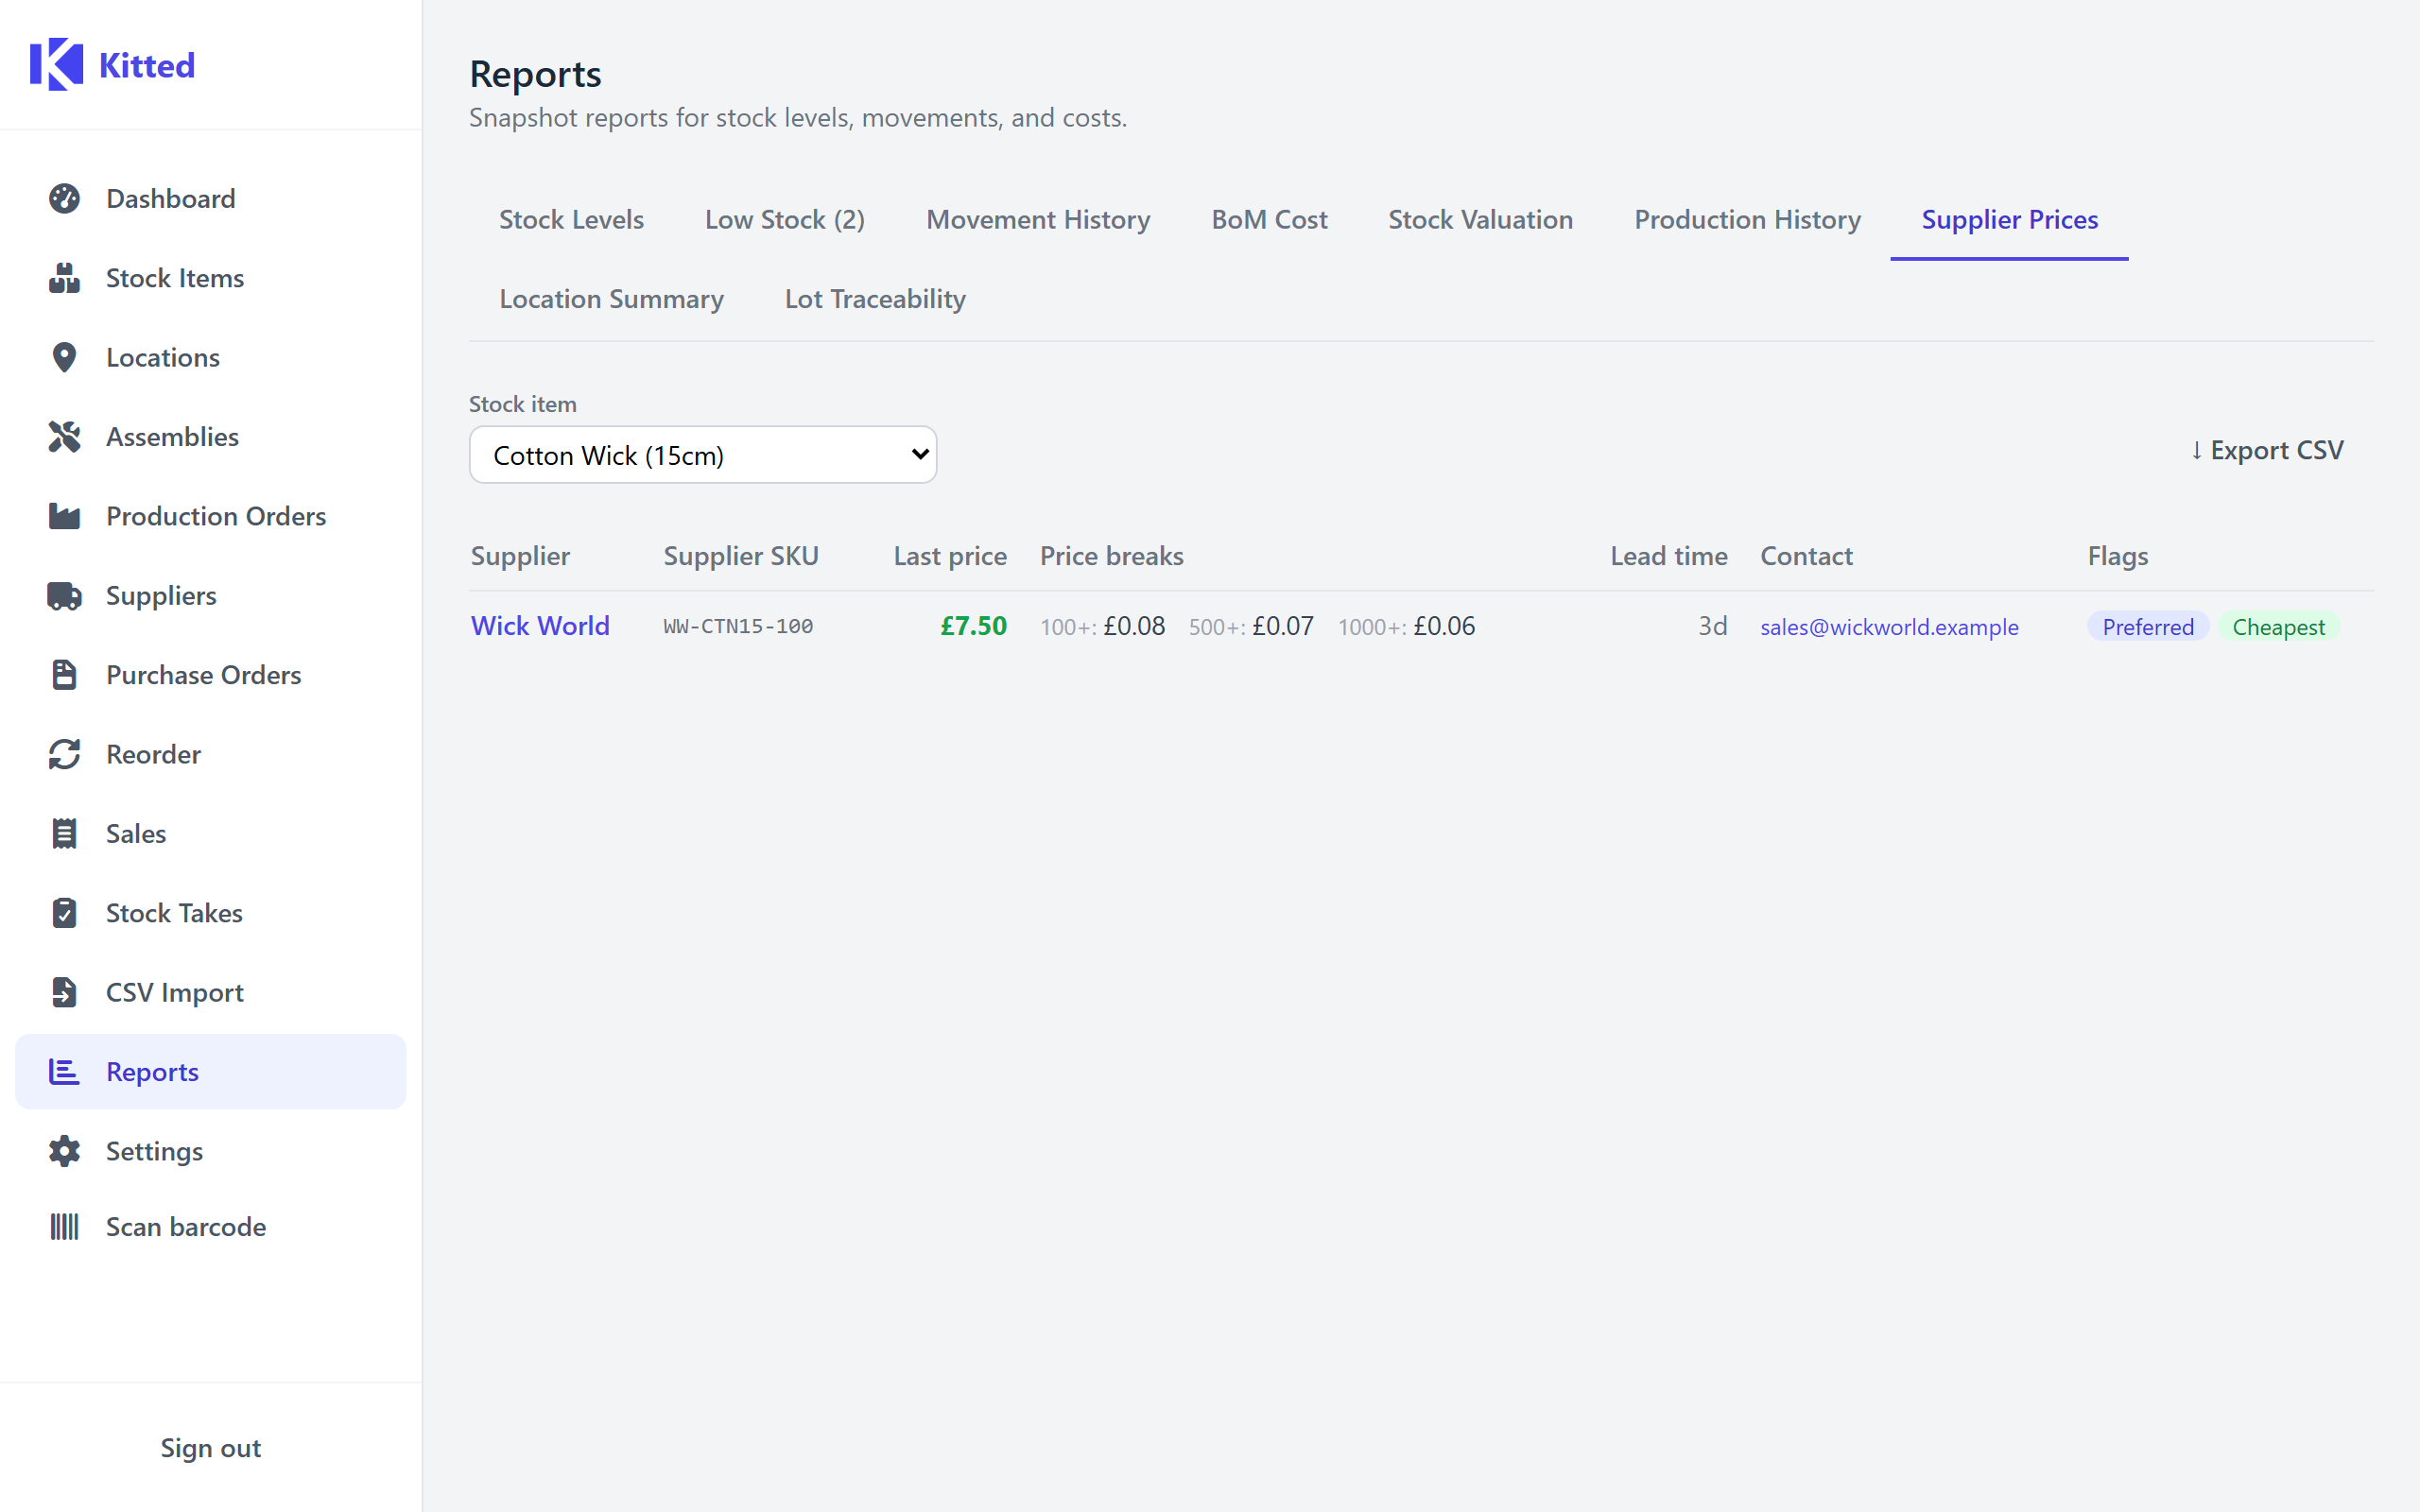
Supplier Prices
Shows all supplier links for a chosen stock item, with last known prices, price breaks, lead times, and contact details.
Input: Select a stock item from the dropdown.
Columns: Supplier name, Supplier SKU, Last price, Preferred flag, Lead time (days), Email, Phone, Price breaks.
The cheapest supplier (by last price) is highlighted. Price breaks are shown inline as minQty+: unitPrice tiers.
Export: supplier-prices.csv
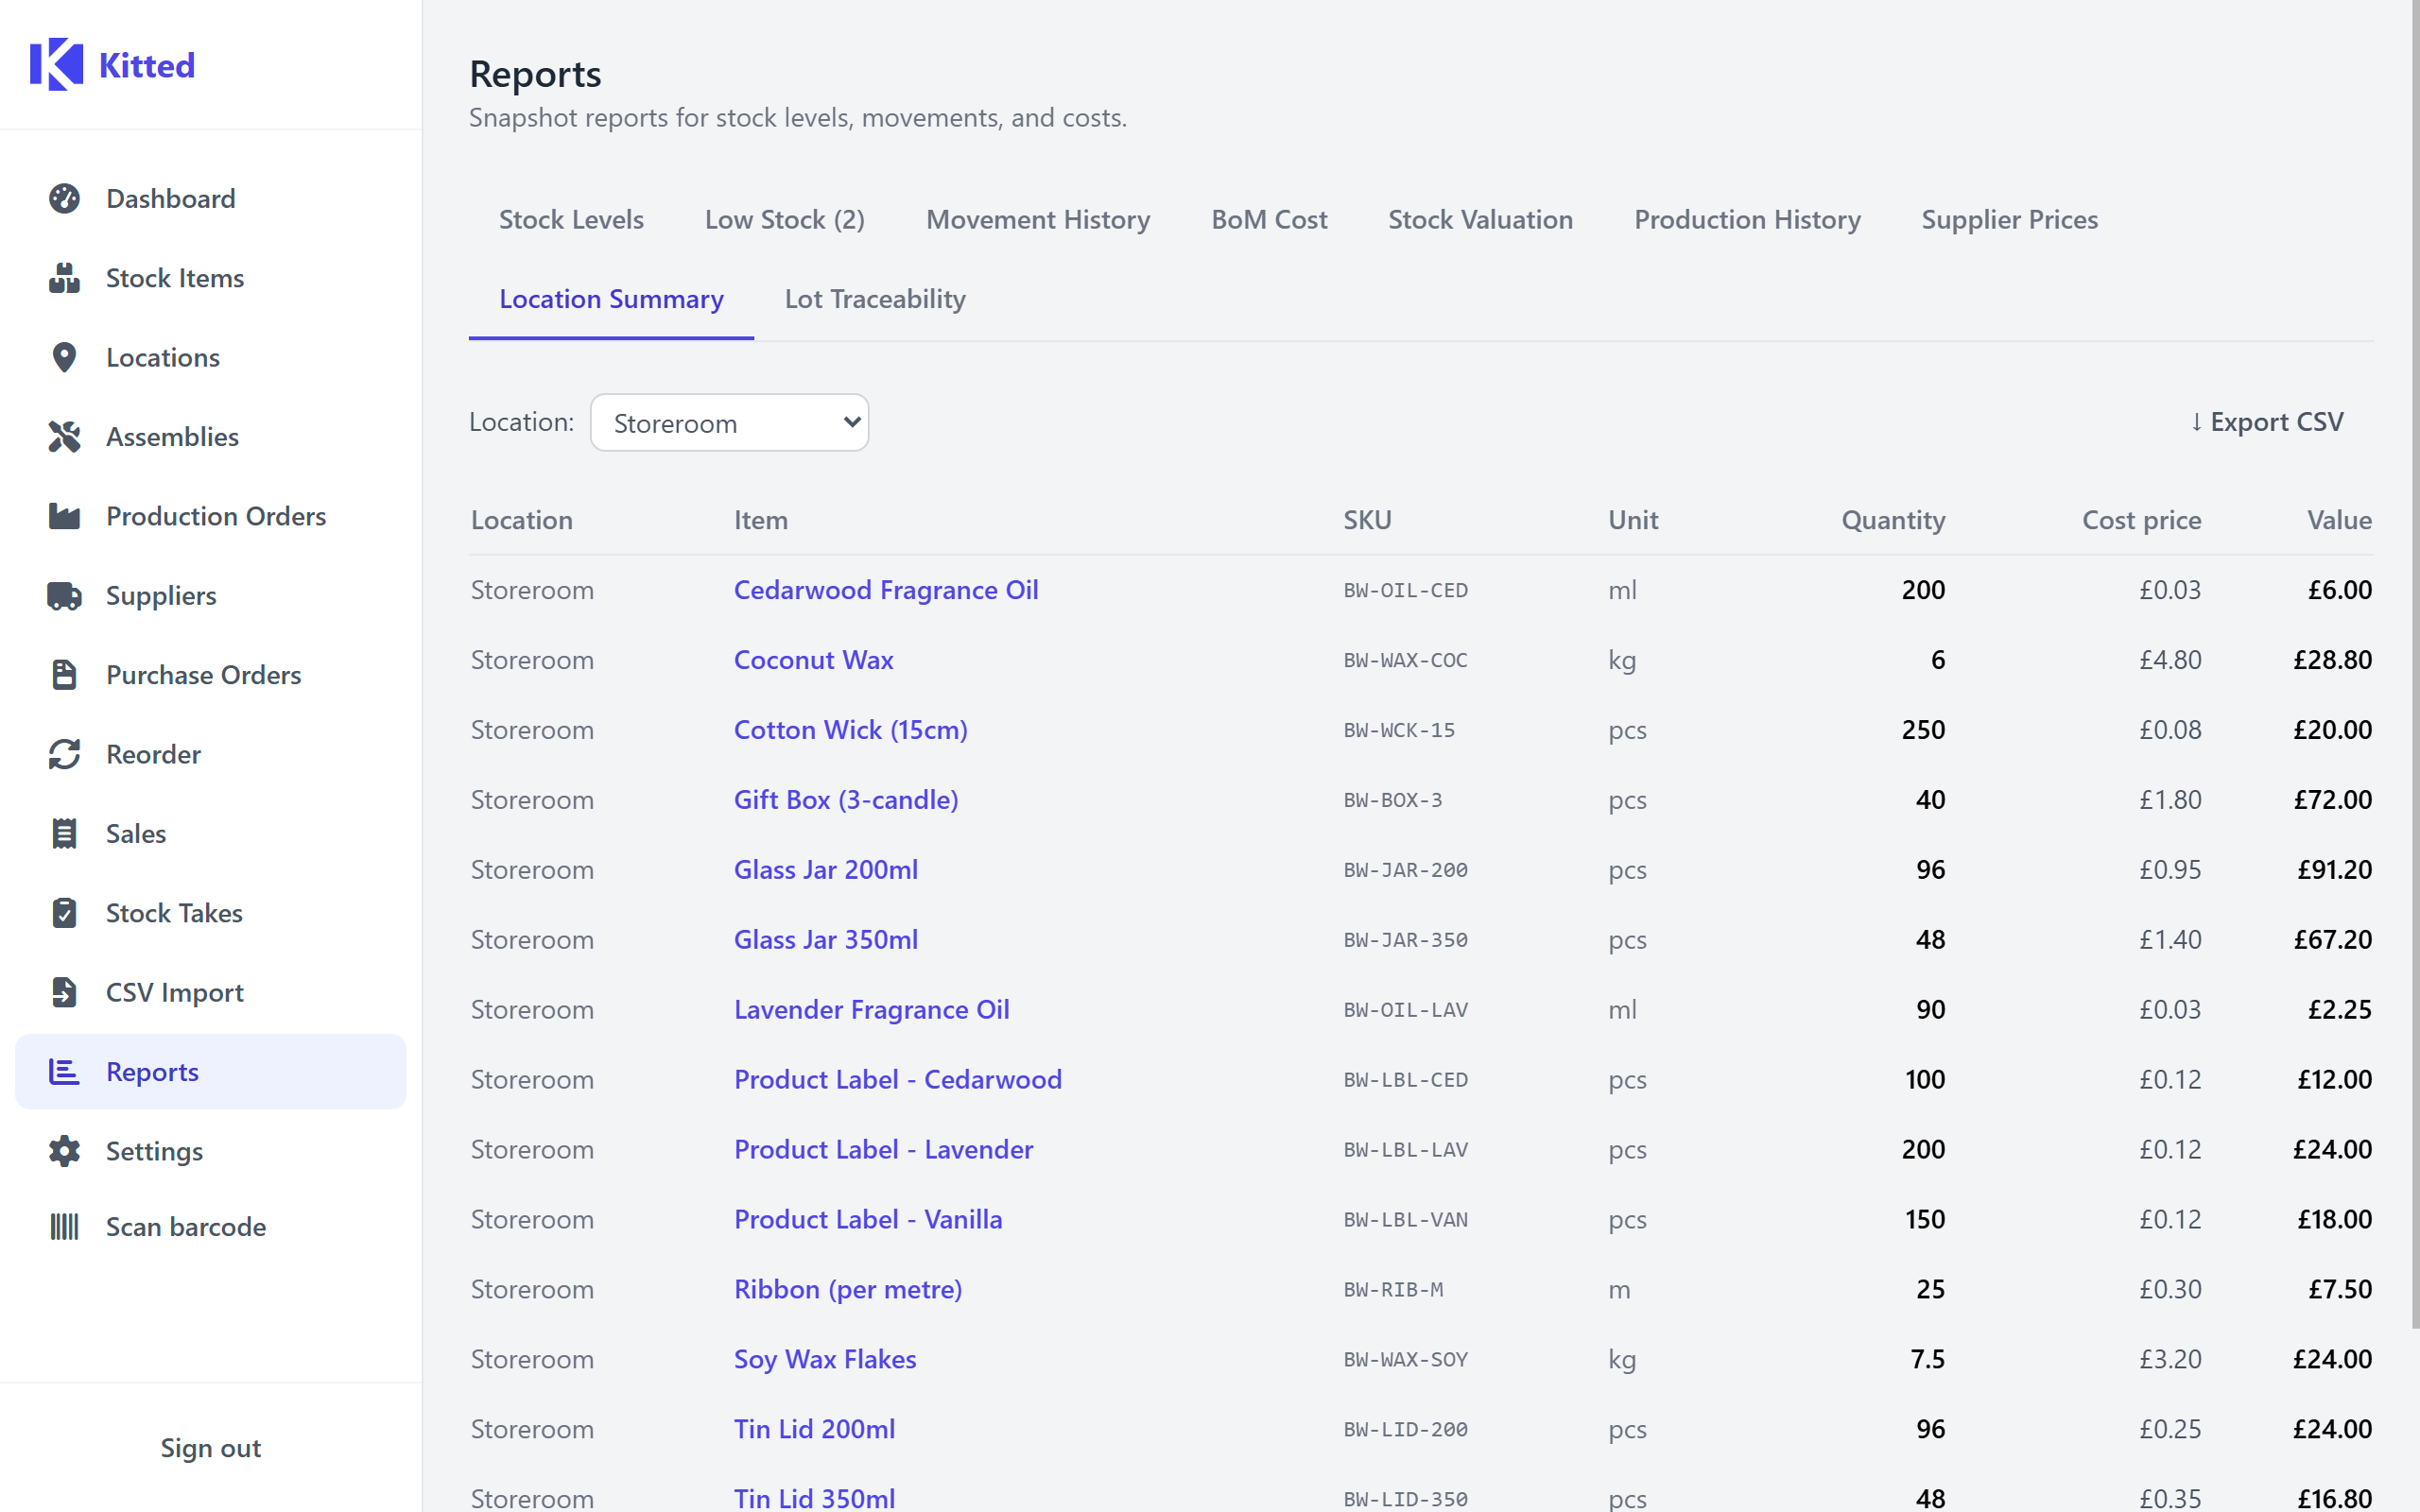
Location Summary
A breakdown of all stock held at each location (only rows with quantity > 0 are included).
Filter: Location dropdown - choose a specific location or leave blank for all.
Columns: Location, Item name, SKU, Unit, Quantity, Cost price, Value (quantity × cost price).
Export: location-summary.csv
Lot Traceability
Only available when at least one stock item has lot tracking enabled. Provides three tools for querying lot-level inventory and tracing batches through production.
Lot inventory by item
Select a lot-tracked item from the dropdown to see all lots currently on hand across every location.
Columns: Lot / Batch, Location, Expiry, Qty on hand.
Lots past their expiry date are highlighted in amber.
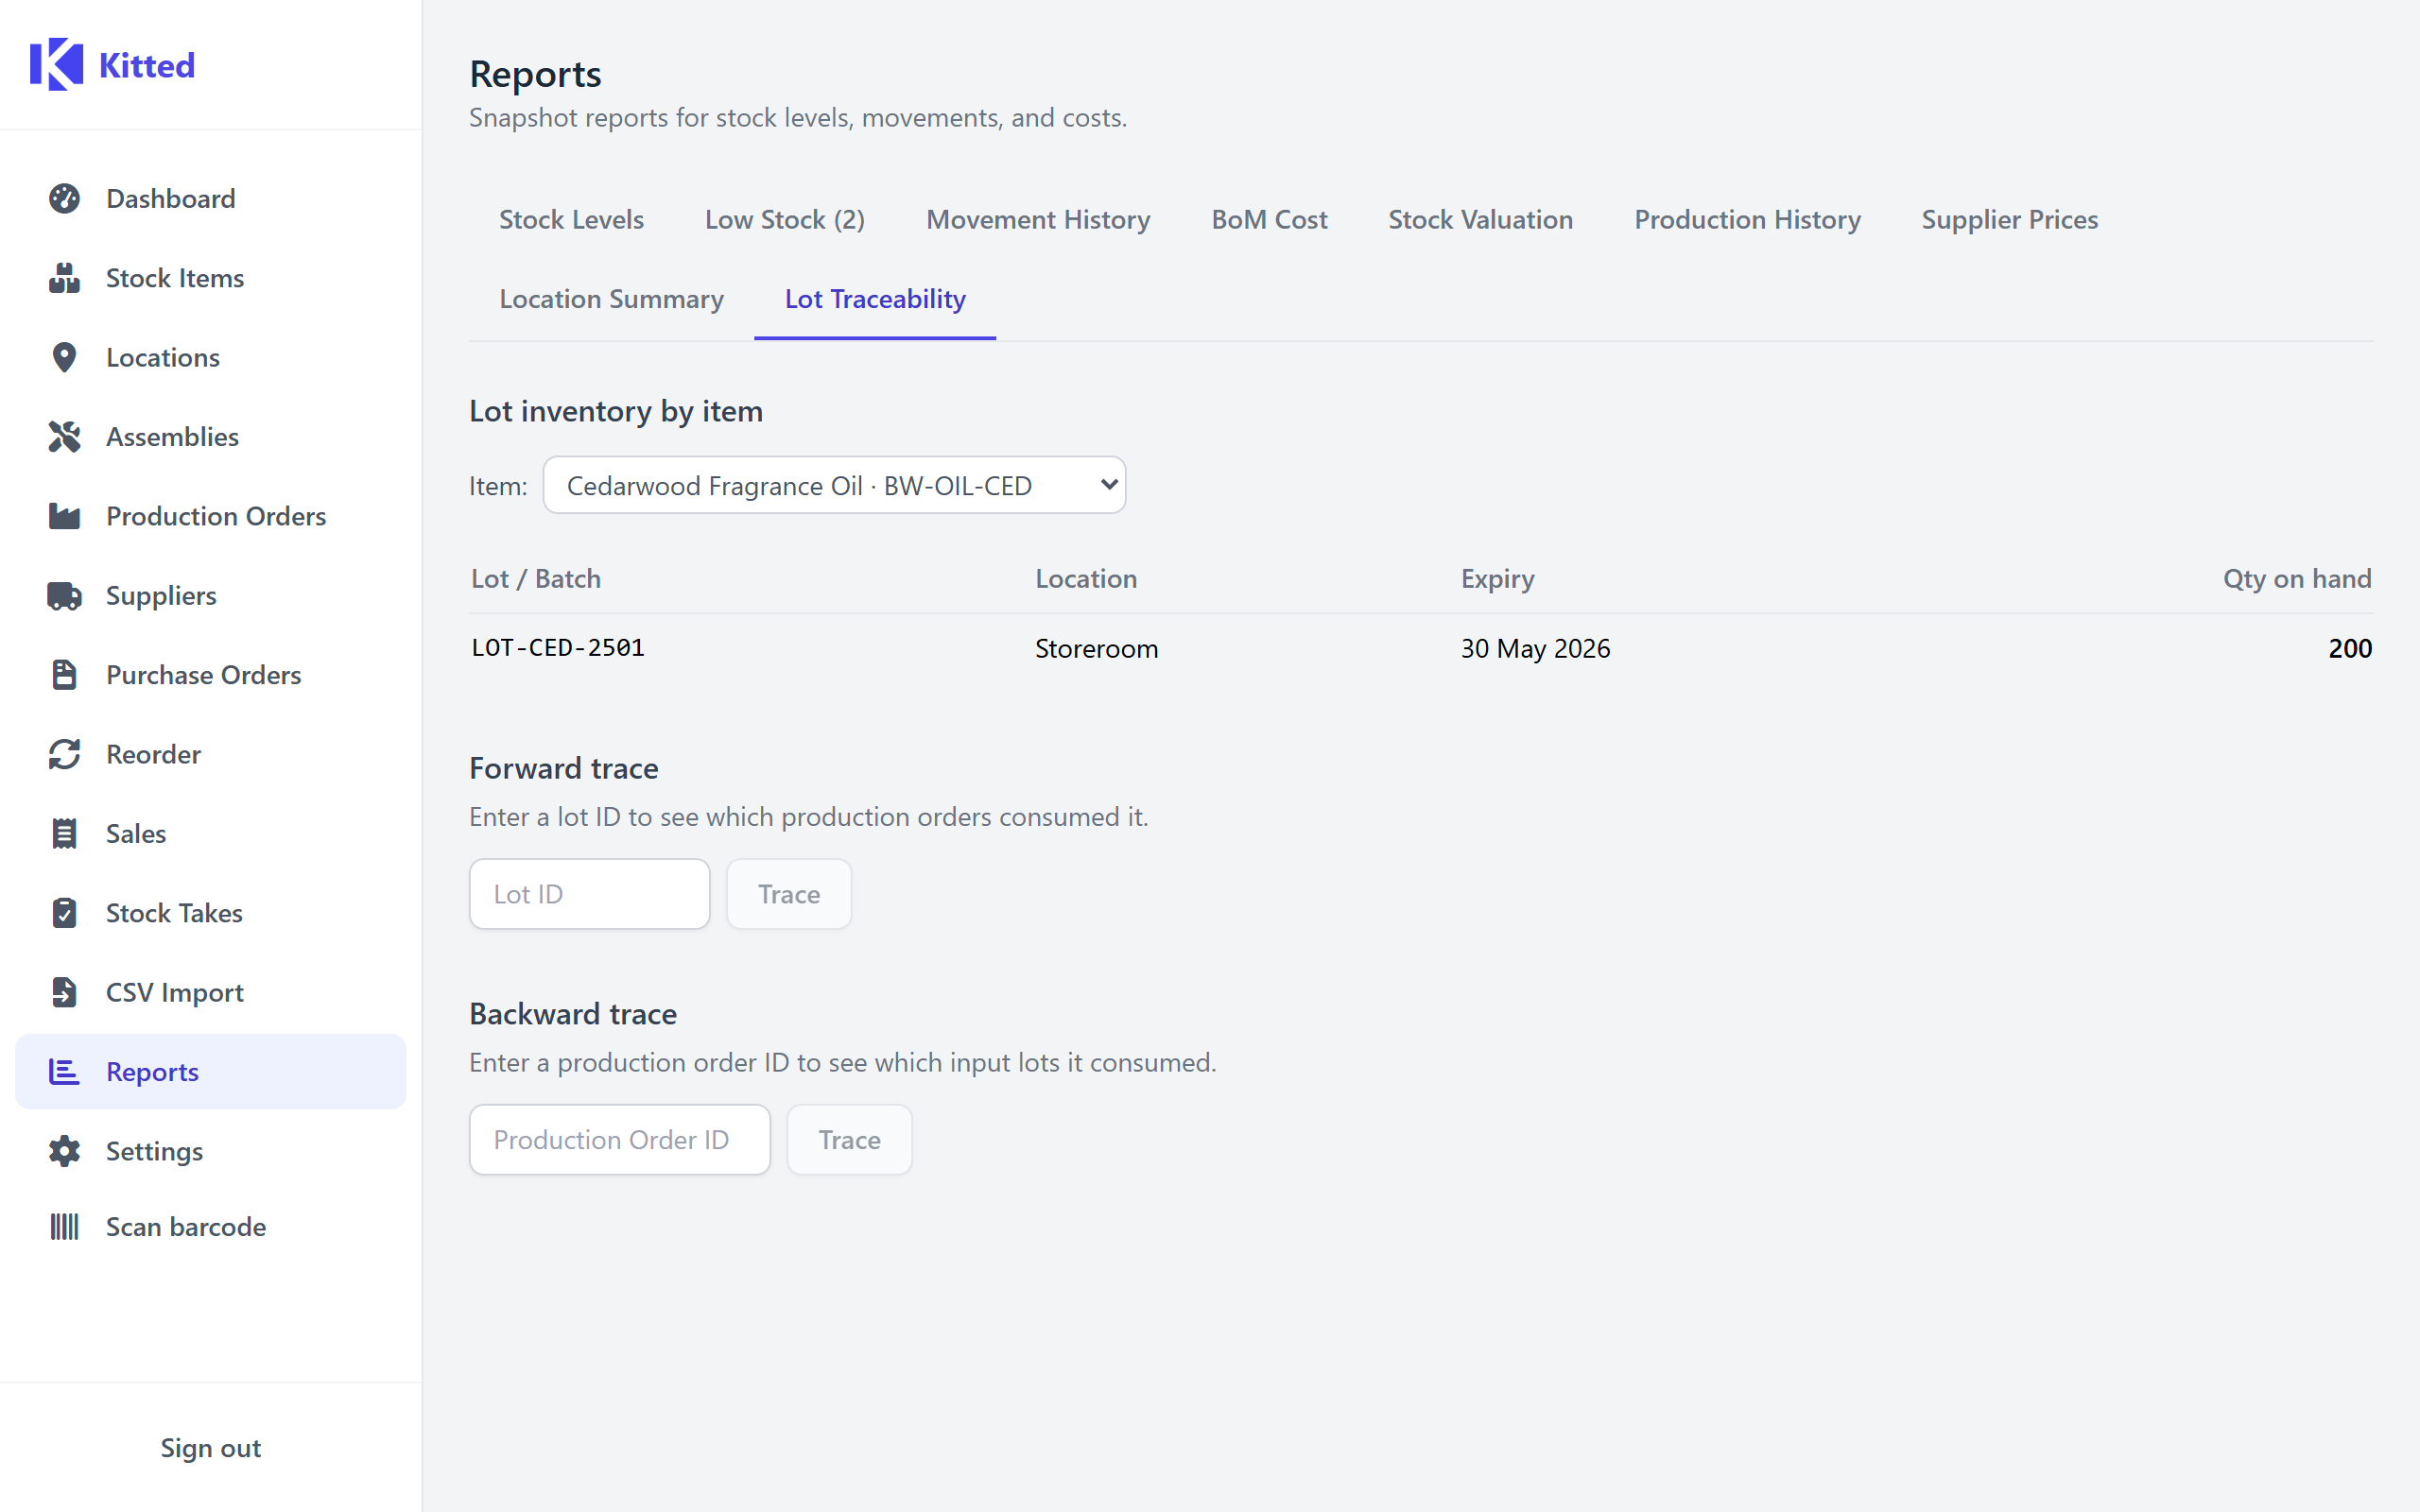
Forward trace
Enter a lot ID (from the inventory table above) and click Trace to see every production order that consumed stock from that lot - which finished goods it contributed to, how much was used, and when the order was completed.
Columns: Production Order (link), Output item, Qty used, Qty made, Completed.
Backward trace
Enter a production order ID and click Trace to see every lot-tracked input consumed by that order.
Columns: Lot / Batch, Input item, Expiry, Qty used.
See Lot / Batch Tracking for a full explanation of the lot tracking system.
Margin
Shows the margin (profit percentage and absolute amount) for every non-archived stock item, with an optional per-assembly cost breakdown. Loads automatically when you open the Reports page.
The report has two sub-tabs:
Overview
A table of all stock items (both plain items and assemblies) with their cost price, sale price, and calculated margin.
Options:
| Option | Description |
|---|---|
| Hide items with missing prices | Hides rows where either cost price or sale price is blank. The number of hidden rows is shown next to the checkbox. |
| Use BoM rollup cost for assemblies | For assembly items, replaces the stored cost price with a live BoM rollup (the sum of component costs). Rollups load in the background after the checkbox is ticked. |
Columns: Item name (with “assembly” badge where applicable), SKU, Cost price, Sale price, Margin %, Margin £.
Click any column header to sort by that column. Click again to reverse the sort direction. Items with missing data sort to the bottom.
Colour coding:
- Red - negative margin
- Amber - margin below 20%
- Green - margin 20% or above
A warning banner appears if any items in the visible list have a negative margin.
Export: margin-overview.csv
Assembly breakdown
Shows the full BoM cost breakdown for a single assembly alongside a margin summary.
Input: Select an assembly from the dropdown.
The Component cost breakdown table lists every component in the expanded BoM (identical format to the BoM Cost report). Below the table, a Margin summary card shows:
| Stat | Description |
|---|---|
| BoM cost | Total rolled-up component cost. |
| Sale price | The sale price set on the assembly’s stock item. |
| Margin % | (sale - cost) ÷ sale × 100. |
| Margin £ | sale - cost. |
If the assembly’s stock item has no sale price set, an amber notice is shown.
Export: margin-assembly-<name>.csv